Are you using weather events in predictive models?
by Dmitry Bochkov
I like the business predictive models that include climate data.
Do not get me wrong though. I am not a fan of political arguments regarding the global climate change predictions, either based on extrapolation of recent historical weather facts or an analysis of some cyclical geologically derived climate variations. I am also not much into the microclimate models. I am not interested in the localized temperature differences on the south or north slopes of molehills for example. This post will discuss what most data scientists, and correspondingly most business data analytics software systems, are using for the weather part of the data processing engines and, of course, some exceptions to the rules.
For the purpose of most practical business data analytics applications, climate is a twenty to forty years set of statistical geospatial and temporal data including air temperature, wind speed, and precipitations. It does not matter if you are in the business of agricultural machinery, outdoor power equipment, or marine freight insurance – these three variables provide the most information you need to know to derive the weather induced variations of your key performance indicators and their predicted values.
On the very surface, the minimum and maximum daily measurements of the air temperature provide enough information to calculate seasonality, frost line movement, count of freeze free days, etc. The precipitation data are good indicators of drought indices and seasonal floods. The wind speed is the best input for the risk assessments for the hurricane-prone locations.
What is the best about climate data? They are quite stable in the limited date range, so you can rely on the mean and average values for seasonal changes within few days every year, and for the locations within hundred mile areas. This makes weather data a real foundation of the geospatial and temporal analytics. It is really safe and comfortable to find look-alike regions or periods of time, whether they are called ‘plant hardiness zones’ or ‘local growing seasons’.
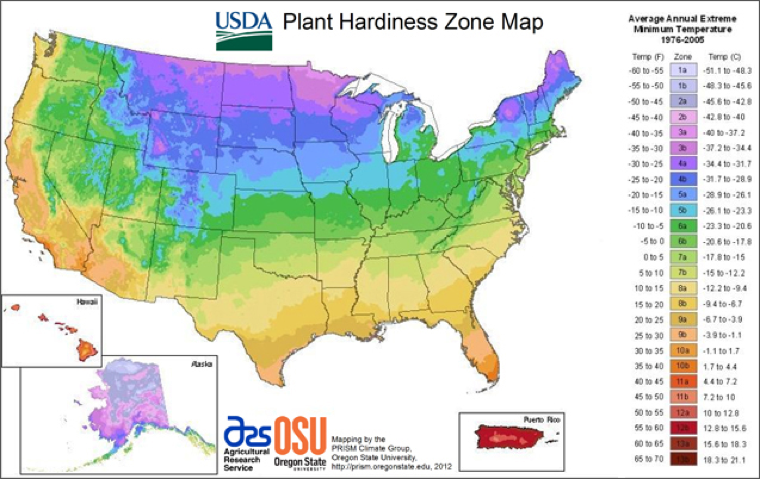
Source: http://planthardiness.ars.usda.gov/PHZMWeb/
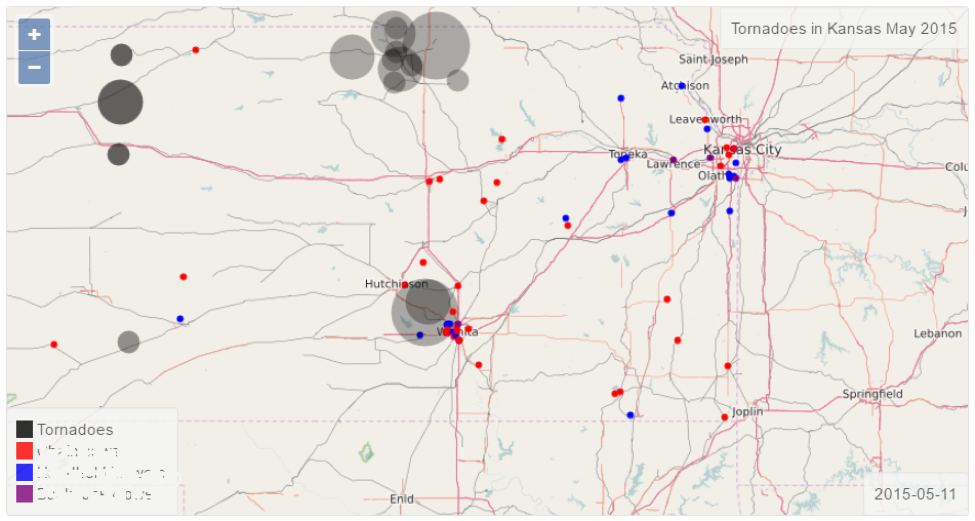
So, the climate data are very simple and reliable data that you may update once every ten years and happily use it in every location or time based calculations. Not so fast! Look at the hardiness zones map again. The common experience tells us that there is some weather difference between, let say, Connecticut and Kansas even if they are mostly in the same zone. Of course, there are tornadoes in Kansas! Connecticut – not that many, not even a sharknado (New York City seems to be the most northern location for the latter.)
The NOAA Storm Events Database (https://www.ncdc.noaa.gov/stormevents) contains significant amount of information regarding “storms and other significant weather phenomena having sufficient intensity to cause loss of life, injuries, significant property damage, and/or disruption to commerce”. This is a piece of data that many predictive models are missing in their calculations.
There is a simple explanation why the majority of enterprise analytical software systems do not include the storm events – there are too many of them, some are sufficiently classified (for example, EF-Scale for tornadoes), some like snow storms are not classified at all, some are just dramatic media events like snow anomaly in San Diego, and so on.
The Black Ink analytical engine is capable of cleansing and match merging the relevant weather events in a specific territory to combine with other data sources and produce truly comprehensive models. Mean times between events, temporal and geographical distribution of the storm events by category, force, duration, damage and other attributes are some of the variables that our models are using for the clustering and associations.